Corona Satellite Imagery
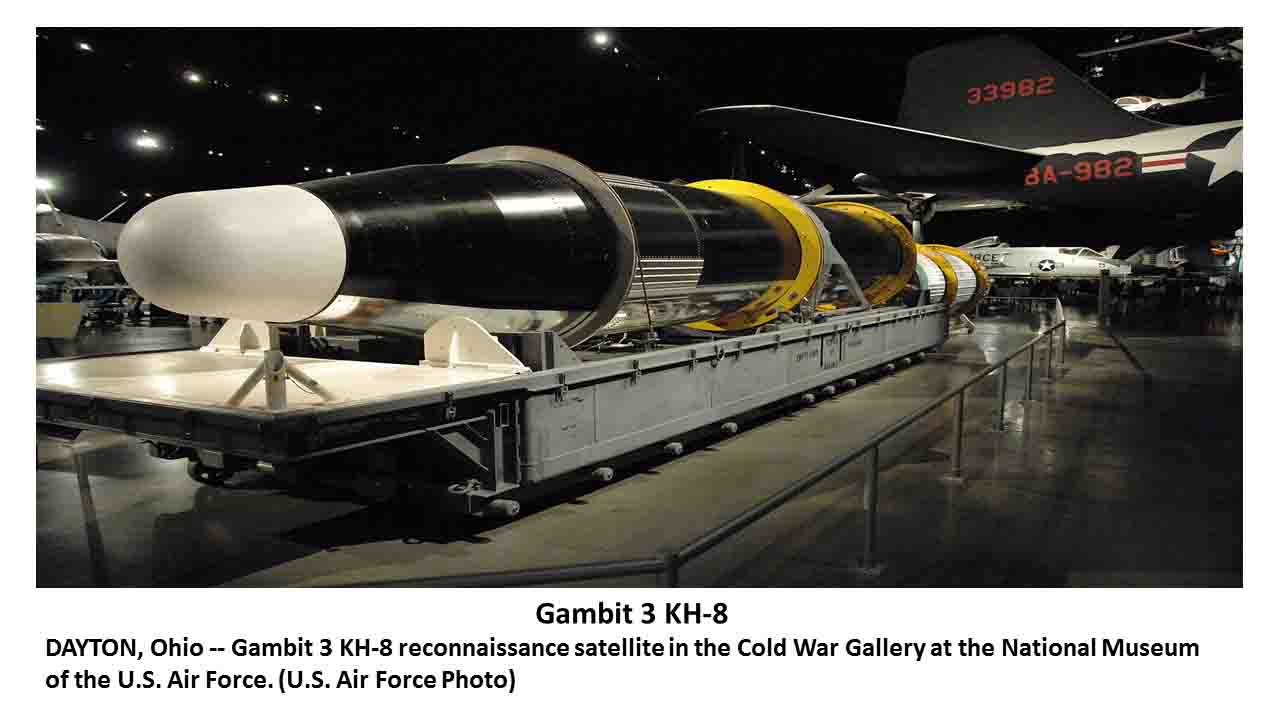
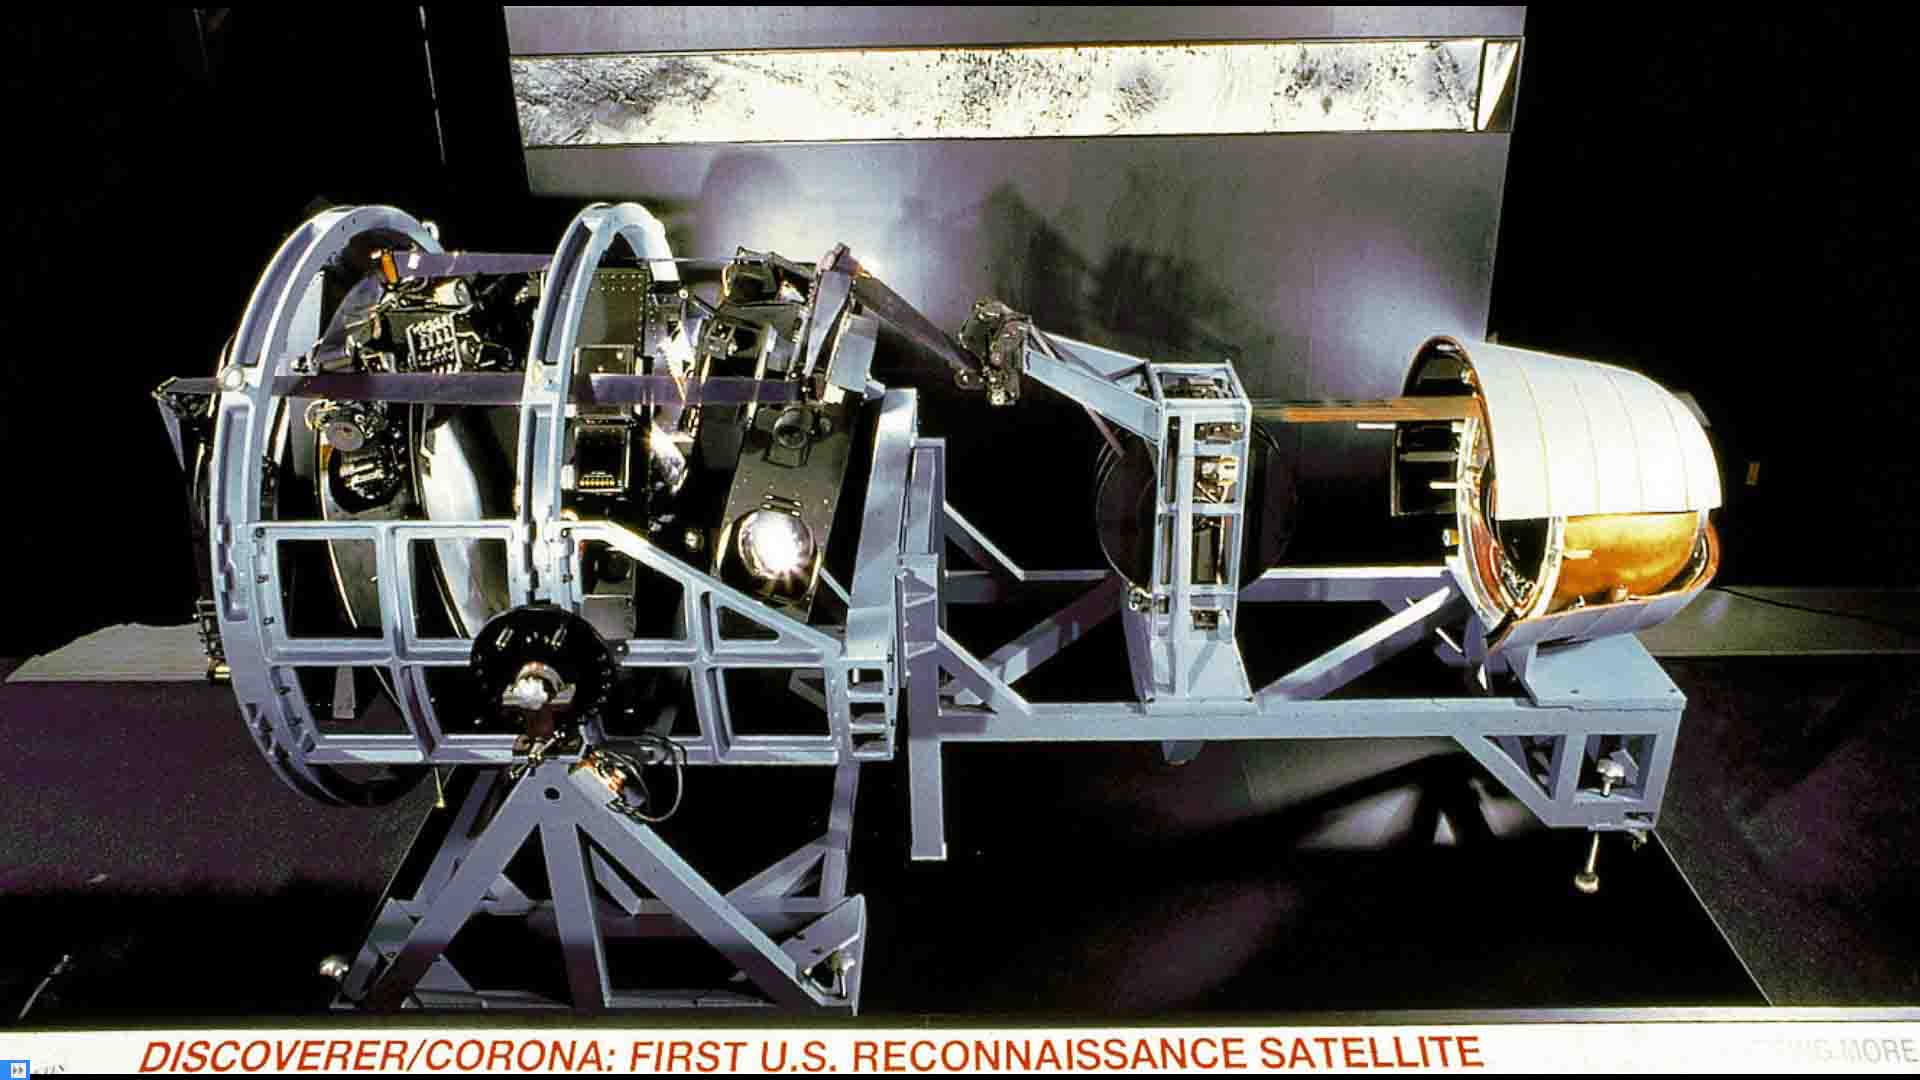
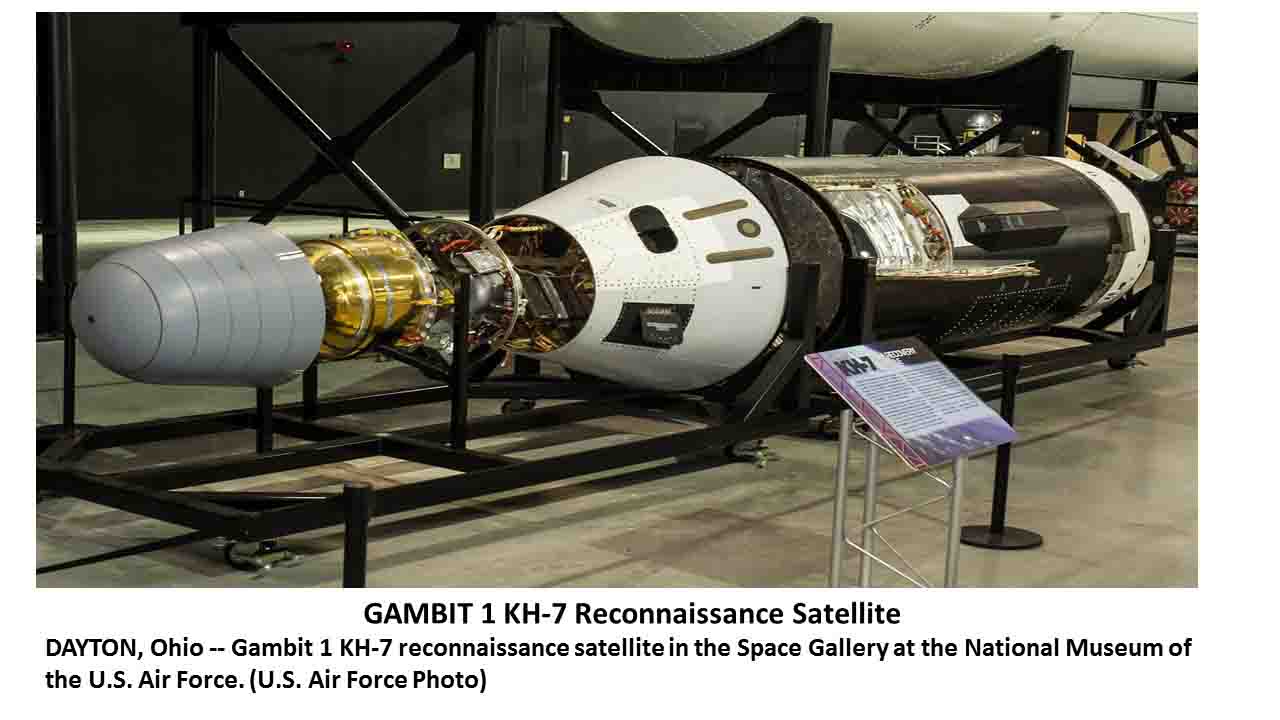
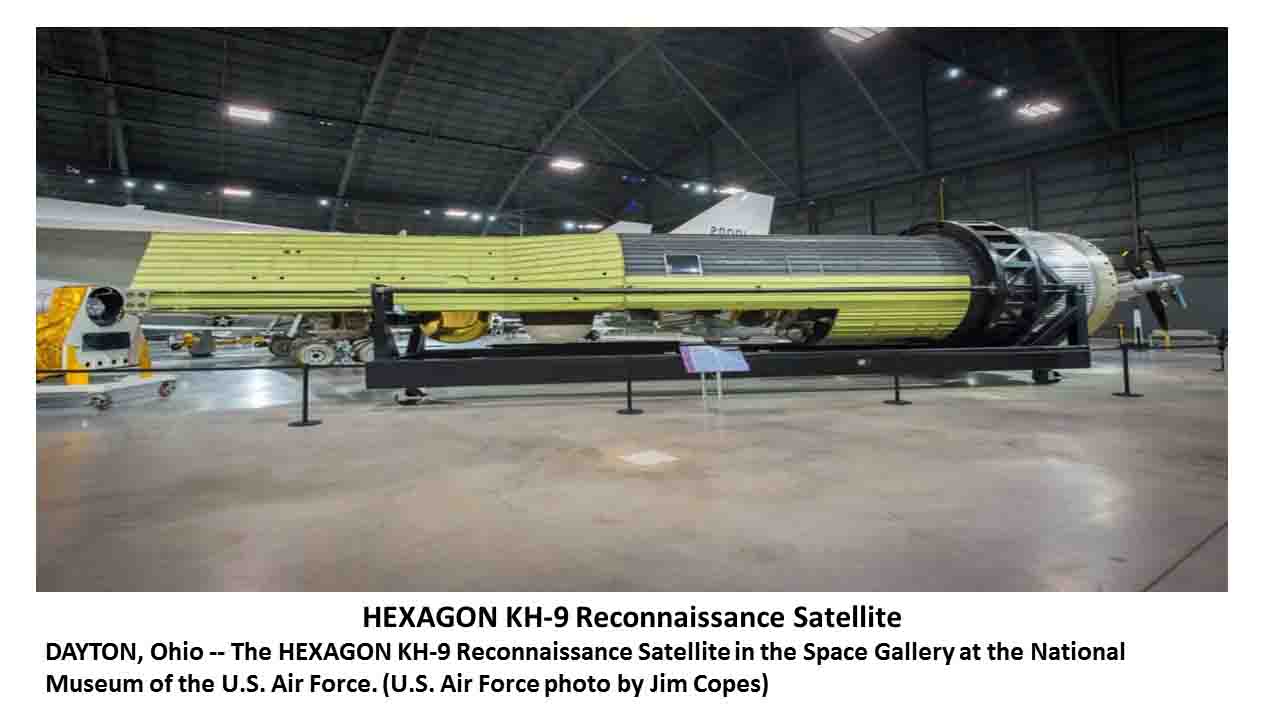
The first generation of U.S. photo intelligence satellites collected more than 860,000 images of the Earth’s surface between 1960 and 1972. The classified military satellite systems code-named CORONA, ARGON, and LANYARD acquired photographic images from space and returned the film to Earth for processing and analysis. The images were originally used for reconnaissance and to produce maps for U.S. intelligence agencies. In 1992, an Environmental Task Force evaluated the application of early satellite data for environmental studies. Since the CORONA, ARGON, and LANYARD data were no longer critical to national security and could be of historical value for global change research, the images were declassified by Executive Order 12951 in 1995. The first successful CORONA mission was launched from Vandenberg Air Force Base in 1960. The satellite acquired photographs with a telescopic camera system and loaded the exposed film into recovery capsules. The capsules or buckets were de-orbited and retrieved by aircraft while the capsules parachuted to earth. The exposed film was developed and the images were analyzed for a range of military applications. The intelligence community used Keyhole (KH) designators to describe system characteristics and accomplishments. The CORONA systems were designated KH-1, KH-2, KH-3, KH-4, KH-4A, and KH-4B. The ARGON systems used the designator KH-5 and the LANYARD systems used KH-6. Mission numbers were a means for indexing the imagery and associated collateral data. A variety of camera systems were used with the satellites. Early systems (KH-1, KH-2, KH-3, and KH-6) carried a single panoramic camera or a single frame camera (KH-5). The later systems (KH-4, KH-4A, and KH-4B) carried two panoramic cameras with a separation angle of 30° with one camera looking forward and the other looking aft. The original film and technical mission-related documents are maintained by the National Archives and Records Administration (NARA). Duplicate film sources held in the USGS EROS Center archive are used to produce digital copies of the imagery. Mathematical calculations based on camera operation and satellite path were used to approximate image coordinates. Since the accuracy of the coordinates varies according to the precision of information used for the derivation, users should inspect the preview image to verify that the area of interest is contained in the selected frame. Users should also note that the images have not been georeferenced.
Data Access
Corona Data Usage
Moshaver Hamrah Company (MHC) has provided this opportunity for you, to be able to access Corona satellite imagery by ordering any place in Iran and neighboring countries. For this purpose, it is necessary to prepare a specific box from the study area (KMZ format) and send it to us along with the imagery date. Our experts will contact you as soon as possible.
Note:
The company is not responsible for Corona satellite image problems including resolution, distortion, clarity, transparency, etc.
After ordering Corona satellite images, a copy of it will be posted on the https://earthexplorer.usgs.gov/ within a month as free online data.

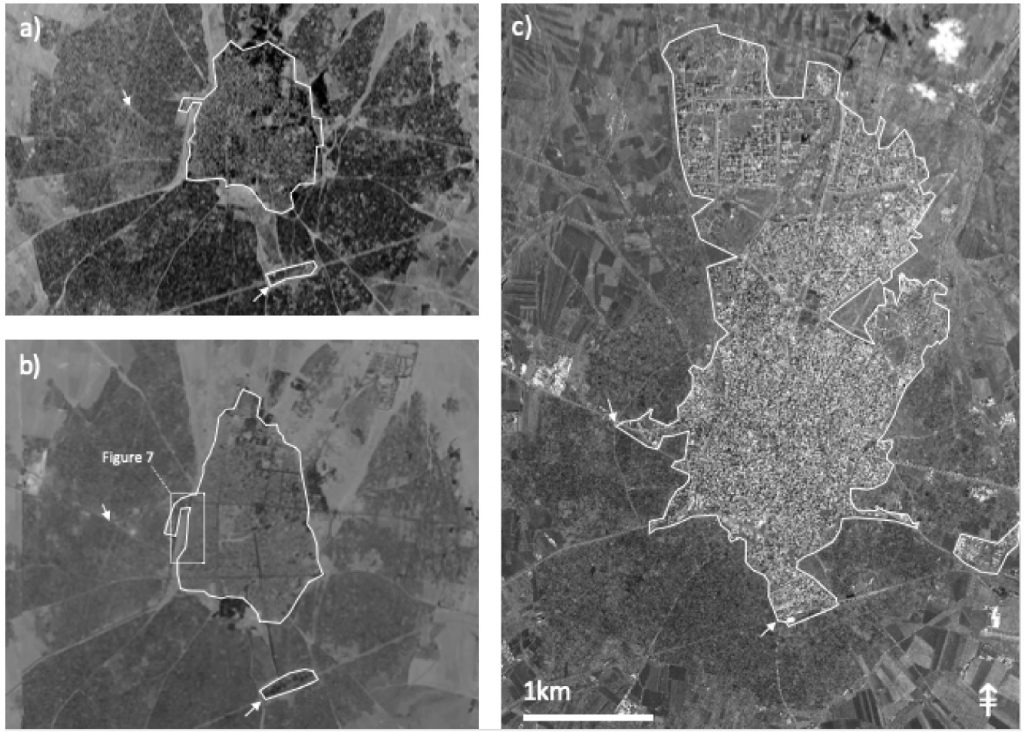
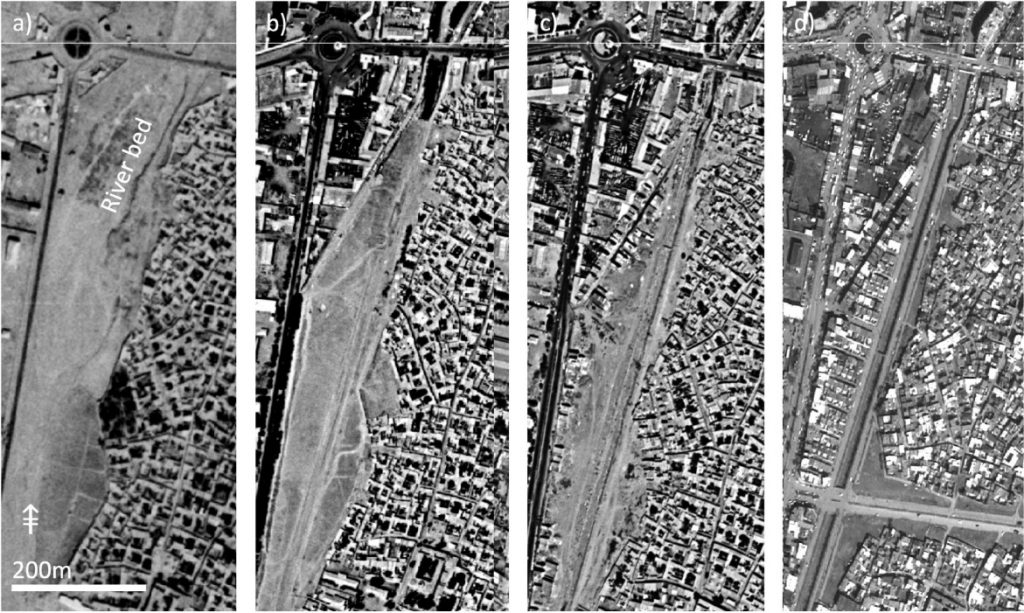
Qazvin and the nearby plain close to the Ipak Fault, Iran experienced a major earthquake on 1 September 1962, with 12,225 victims (Berberian, 1976). This area is notable since it is along with the Alborz mountain range with major fault lines close by. Cities in close distance of around 150 km such as Tehran and Karaj, have experienced massive urban growth since the 1970s (Fekete et al., 2020), and the city of Qazvin also experienced great urban growth rates. However, urban growth started a bit later and is not as massive in scale as Karaj, for example. While the images reveal that Qazvin has doubled its built-up area between the years 1973 and 2005, the city of Karaj has expanded more than 10 times in a similar period (Fekete et al., 2020). No images close to the earthquake fault line could be acquired, and in Qazvin itself, no traces of earthquake damage could be detected. This is also probably due to a lack of images close to the earthquake in the year 1962. However, it is of interest, too, how a city develops in the vicinity of natural hazards. Additionally, for Qazvin, it seems that the built-up area has expanded into hazard-prone areas such as riverbeds. Close-up views of the images reveal a transformation in the urban fabric between the years 1955–2005. The built-up area expands into the former riverbed, including new building types with larger blocks since the year 1973, south of the northern roundabout, followed by smaller houses even closer to the river in the year 1978.
Berberian, M. The 1962 earthquake and earlier deformations along the Ipak earthquake fault. Geol. Surv. Iran 1976, 39, 419–426.
Fekete, A.; Asadzadeh, A.; Ghafory-Ashtiany, M.; Hosseini, K.A.; Hetkämper, C.; Moghadas, M.; Ostadtaghizadeh, A.; Rohr, A.; Kötter, T. Pathways for advancing integrative disaster risk and resilience management in Iran: Needs, challenges and opportunities. Int. J. Disaster Risk Reduct. 2020, 49, 101635.
Declassified CORONA satellite imagery, collected from 1960–1972 as part of the world’s first intelligence satellite program, provides nearly global, high-resolution, stereo imagery that predates many of the land-use changes seen in recent decades, and thus has proven to be an immensely valuable resource for archaeological research. While challenges involved in spatially correcting these unusual panoramic film images have long served as a stumbling block to researchers, an online tool called “Sunspot” now offers a straightforward process for efficient and accurate orthorectification of CORONA, helping to unlock the potential of this historical imagery for global-scale archaeological prospection. With these new opportunities come significant new challenges in how best to search through large imagery datasets like that offered by CORONA.
Jarahi H., Geological Studies in “Identifying, repair, and solidity of Water mason at Choqazanbil Temple Area, Shoosh city, Phase I, Naqsh Avaran Toos Co. 87p.
Casana, Jesse 2020 Global-Scale Archaeological Prospection Using CORONA Satellite Imagery: Automated, Crowd-Sourced, and Expert-Led Approaches. Journal of Field Archaeology 45:S89–S100.Corona Gallery
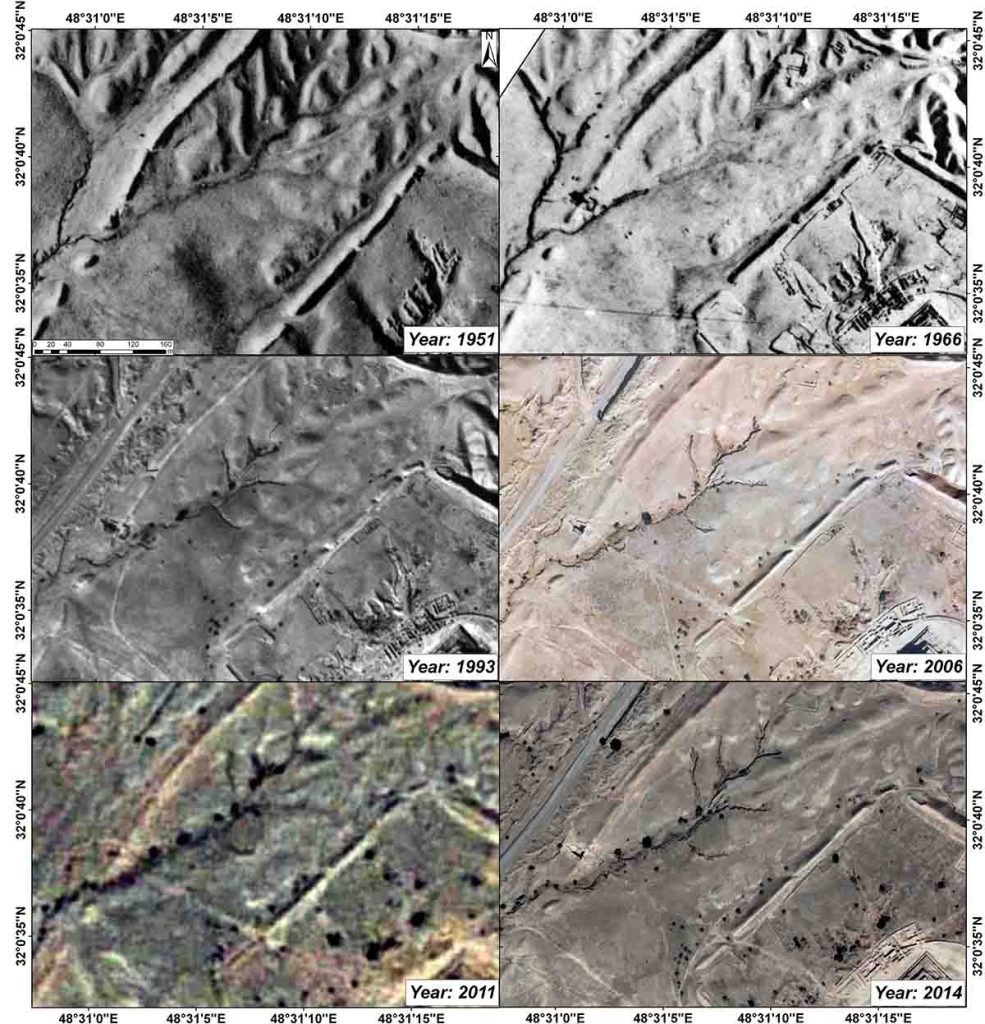
This is an amazing gallery of surface deformation and changes during the 50 years of Iran. We used the
Corona satellite imagery and Quickbird to compare this data.
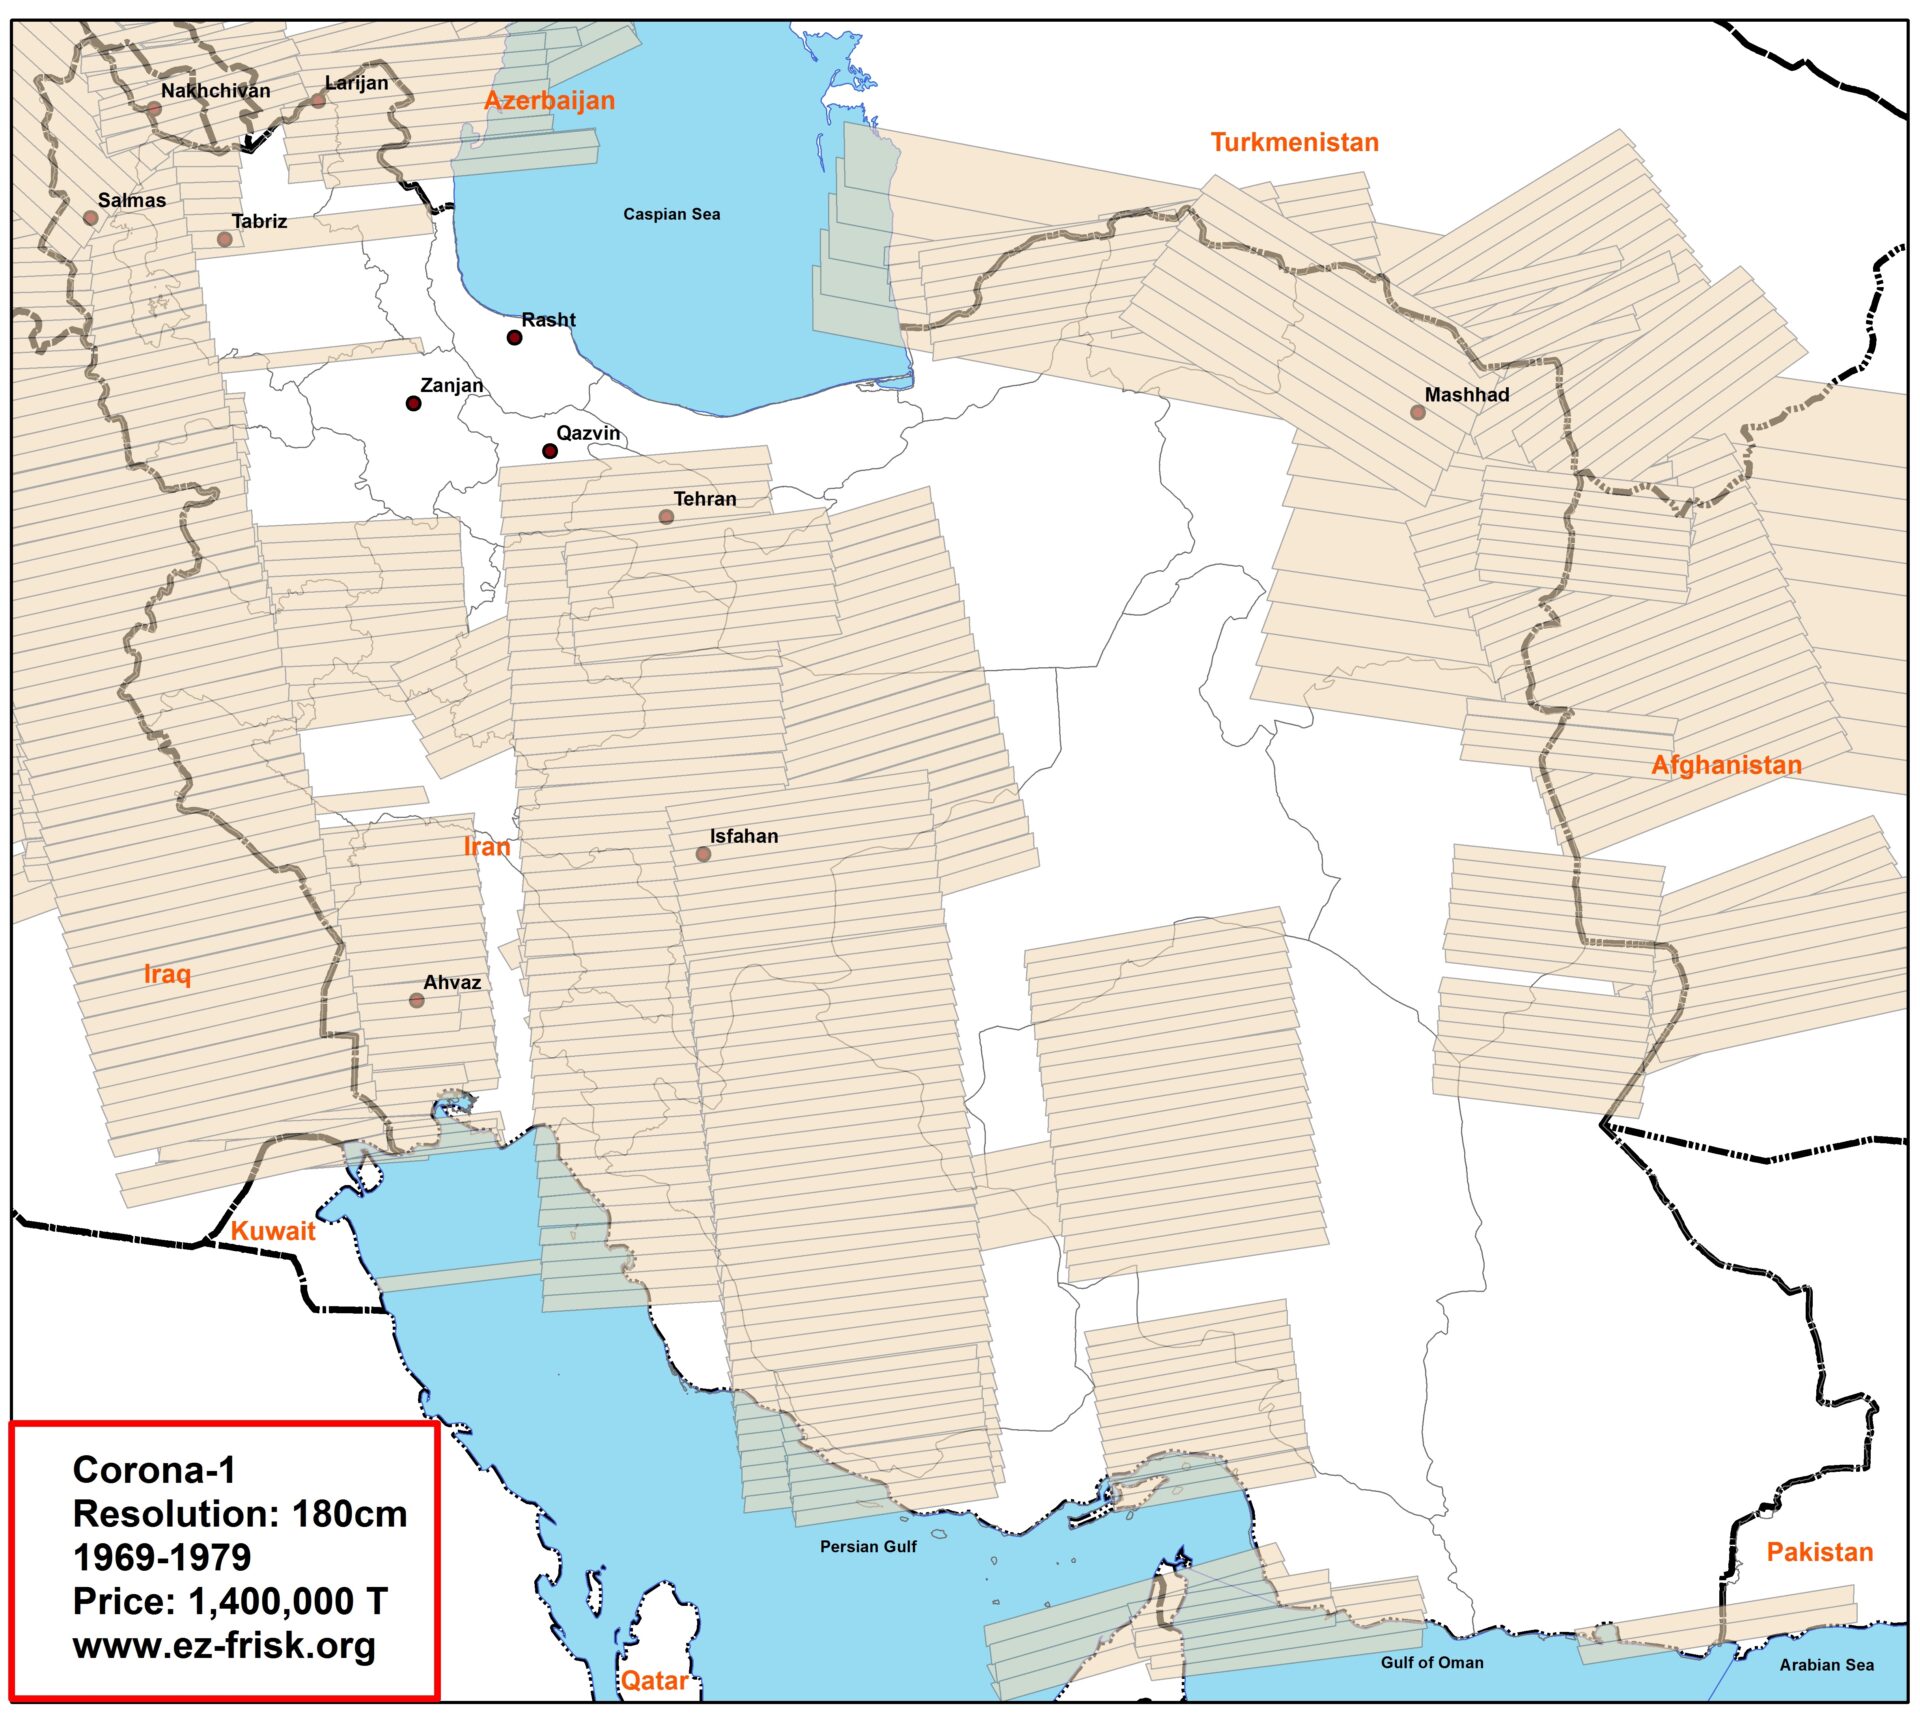
Corona 1, High Resolution Data
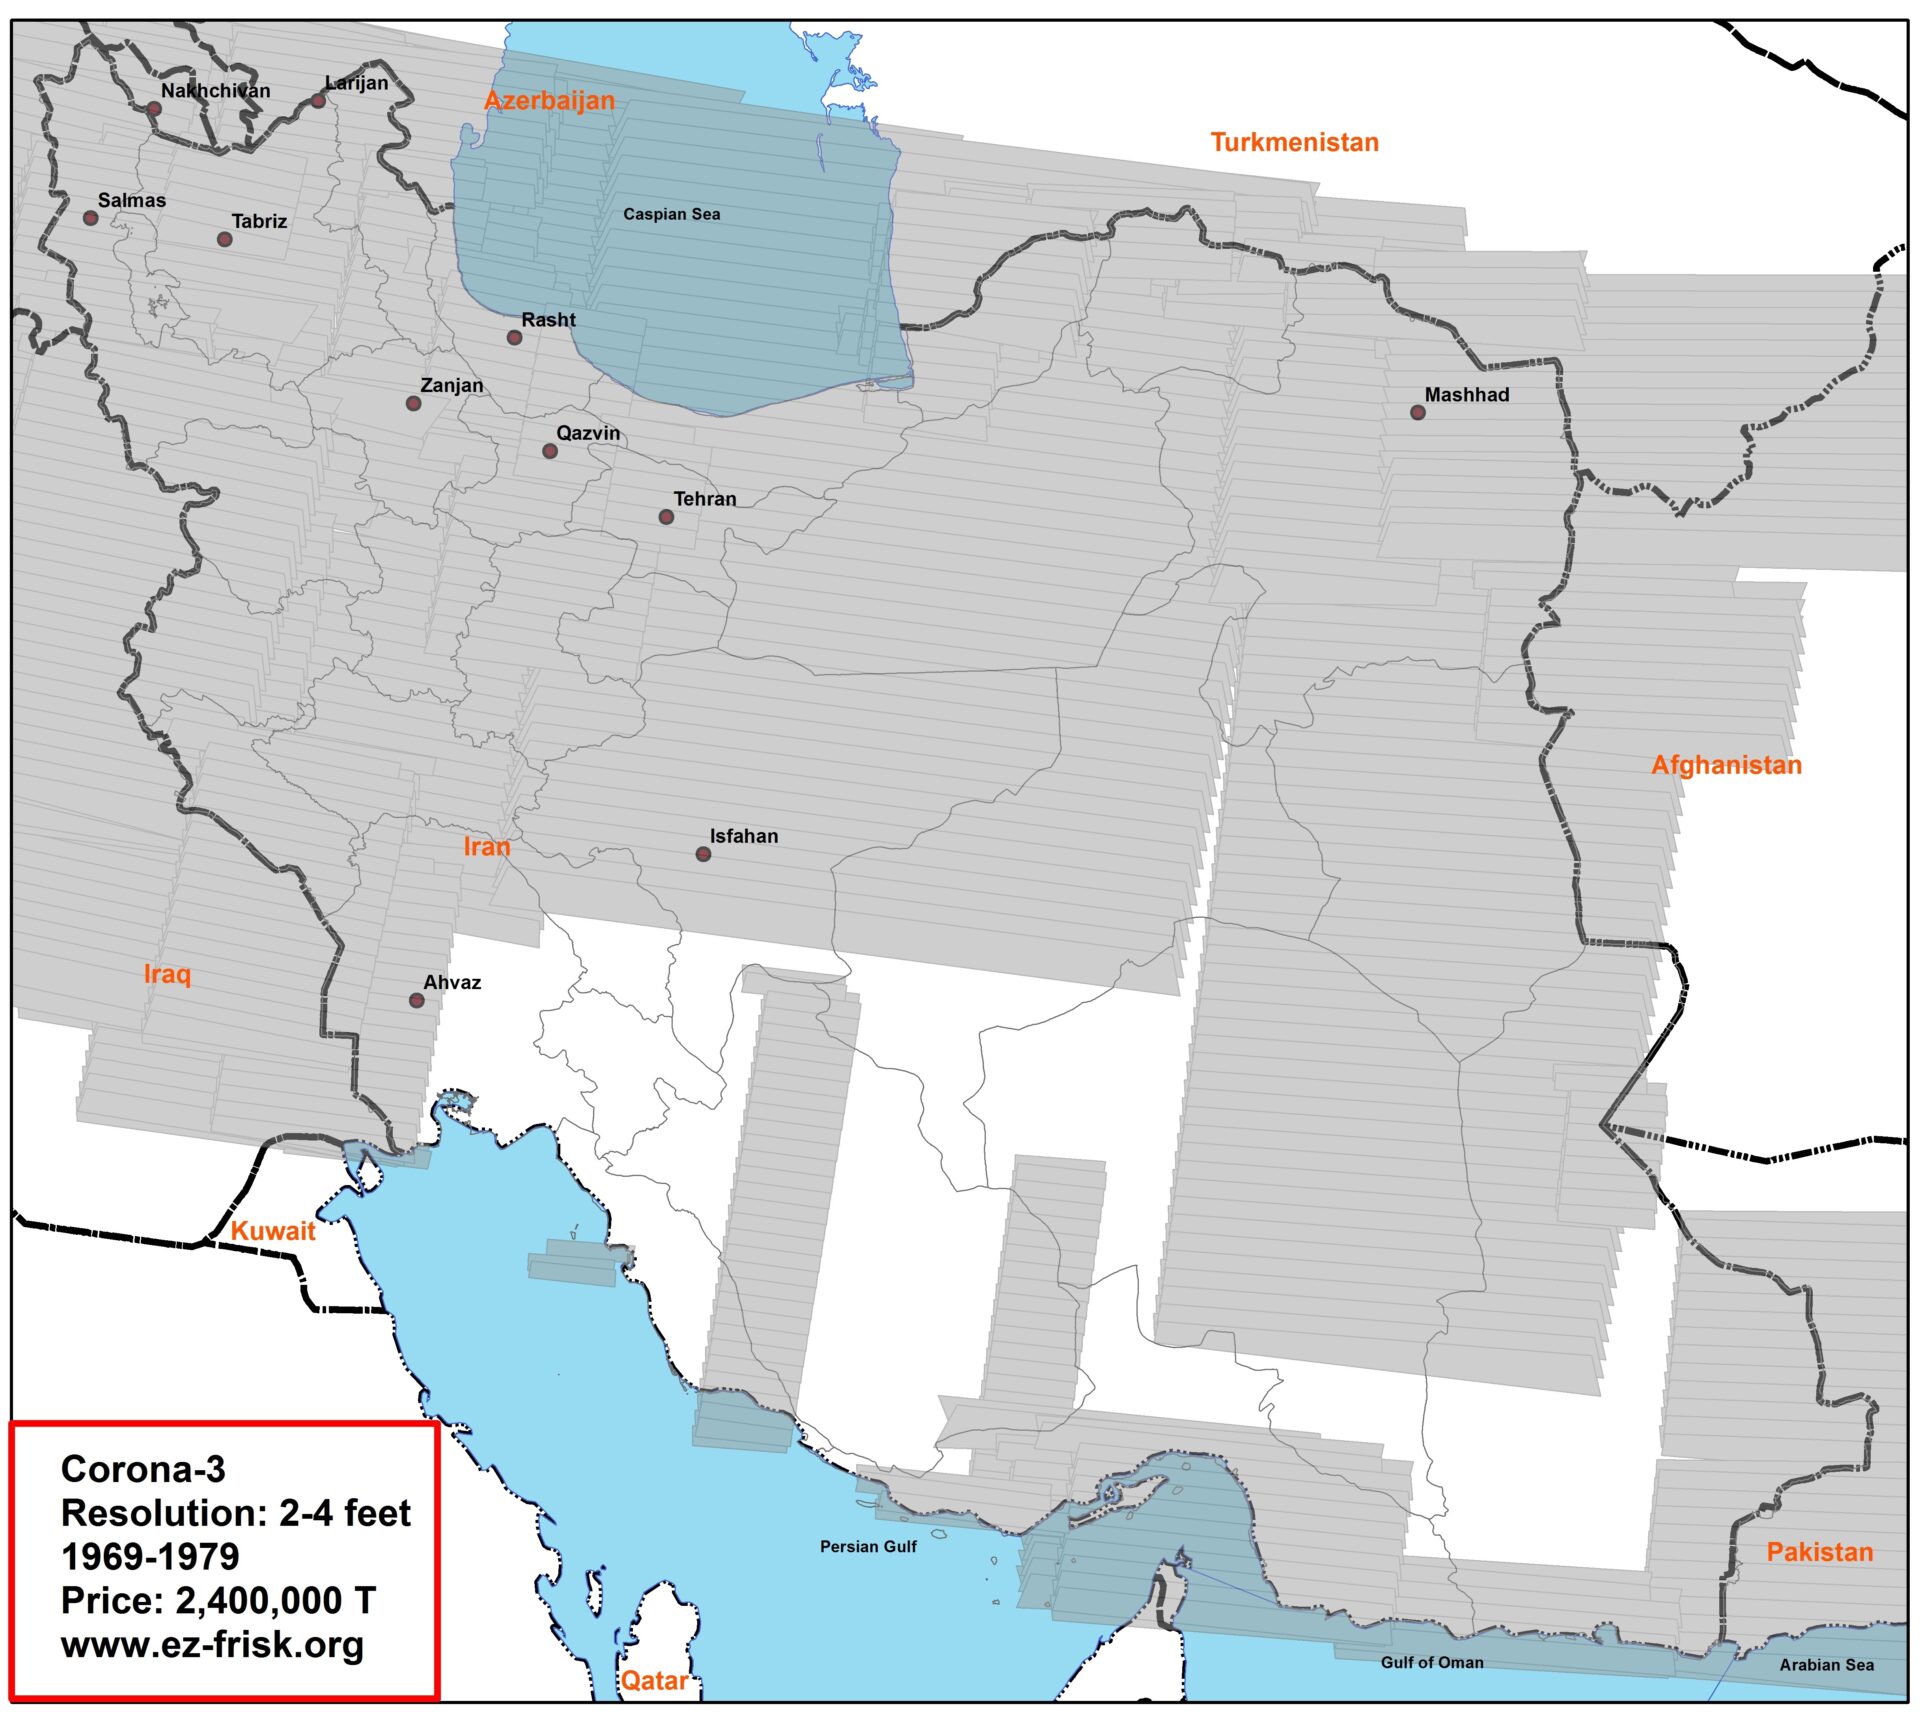
Corona-3 satellite imagery (2-4 m resolution)
